
Our approach
AtSource is designed to provide our customers with sustainability, data insights and traceability through the agricultural supply chain. Learn about our tiered approach in detail.
- AtSource System
- Our Metrics
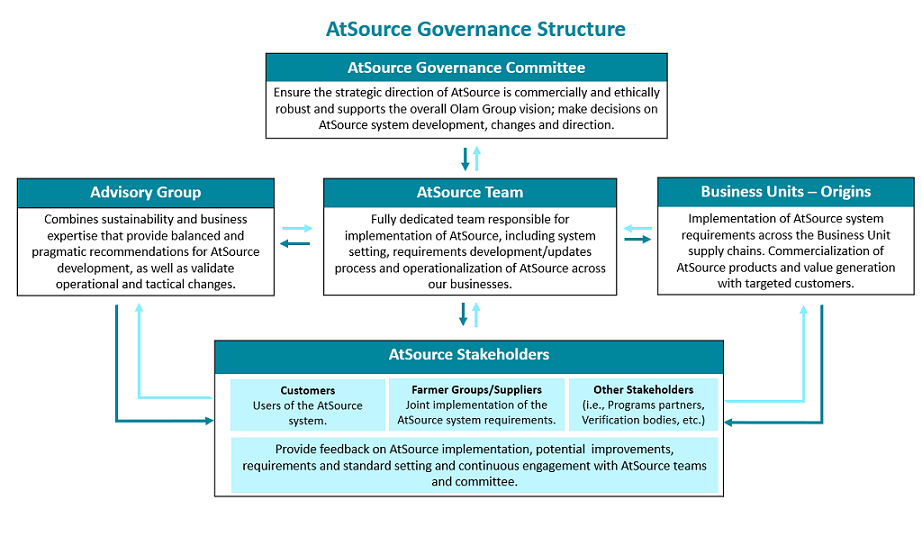
The development, management, and implementation of AtSource is governed by ofi (Olam food ingredients), on behalf of itself and the wider Olam Group companies. The AtSource governance structure and respective roles and decision-making functions are shown in the diagram below.
Scope and system setting:
AtSource is open to ofi and Olam Group product supply chains. AtSource supply chains include all entities that handle the product from the farm where it was cultivated to the final processing site (i.e., farmer groups, intermediary suppliers and facilities and ofi/Olam processing facilities).
The AtSource system requirements are reviewed and updated at minimum every 5 years in a participatory process where our businesses and AtSource stakeholders are proactively engaged and encouraged to provide input on our system components and requirements. Their feedback is internally revised and considered in the following AtSource system update. Our most recent revision of the AtSource system requirements took place in 2023. The AtSource system requirements are fully aligned with our sustainability policies and procedures. We encourage our stakeholders to provide feedback regarding our system that helps us improve our business, make sure our suppliers meet our requirements, and increase transparency in our supply chains. In case of any breaches to our system, policies, or codes these can be reported via our grievance procedure that applies to the whole supply chain accessible in our ofi Speak Out platform and Olam Agri grievances channel or directly contacting us at atsource@ofi.com
Note: AtSource scheme rules and other system documents are available upon request. Please contact us at atsource@ofi.com
These are a set of principles and criteria in the key sustainability areas of agricultural supply chains to ensure responsible sourcing. The sustainability requirements are based on our policies and sustainability strategy and are categorized in our main sustainability pillars and topics linked to the UN’s Sustainable Development Goals and the UN Global Compact.
The Sustainability Assessment Checklist (SAC) is our tool for assessing the compliance and performance of our supply chains against our sustainability requirements. The SAC is used by businesses managing AtSource Supply Chains to conduct annual self-assessments and by external auditors when conducting 3rd party verification audits. The outcomes of these are the foundation for the development of action plans.
Recognising that requirements and risk can apply differently to the distinct types of entities and their activities, the SAC includes specific sustainability requirements for each of the three entity levels (farmer groups or estates, intermediaries, and processing facilities) in the supply chain.
AtSourceV offers a set of requirements in 24 key sustainability areas applicable to the Atsource supply chain.
In addition to the AtSourceV sustainability requirements, AtSource+ includes further and more advanced requirements in each principle, creating additional intervention and impact.
The AtSource Sustainability Principles are:
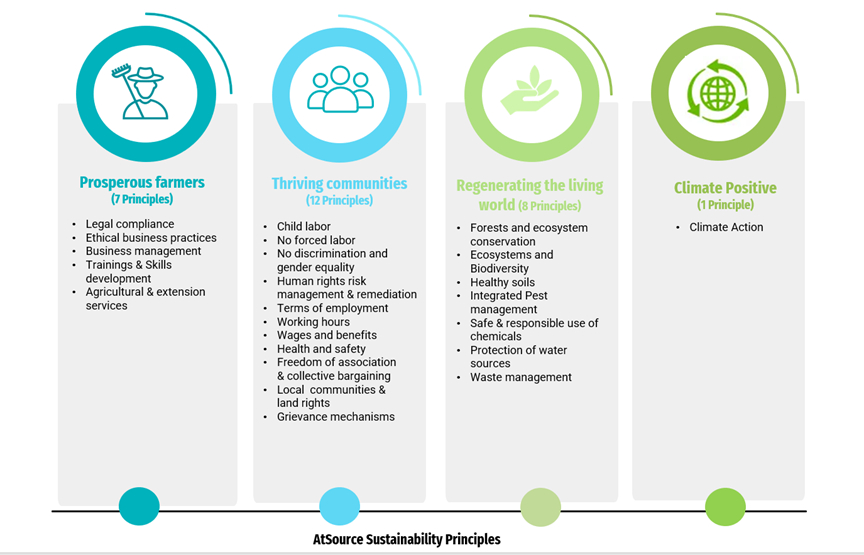
Click here to download AtSource Sustainability Principles
Unacceptable practices
Within the AtSource sustainability requirements, there are certain practices classified as “unacceptable”. These are the minimum requirements to enroll into the AtSource program and are set in the ofi Agri Supplier Code, Olam Agri Supplier Code, and other sustainability policies:
- Worst forms of child labour
- Forced and trafficked Labour
- Physical and/or sexual harassment or violence
- Forced evictions, displacements of local communities and/or no proof of FPIC (Free, Prior & Informed Consent)
- Use of illegal or banned pesticides and fertilisers
- Deforestation - Destruction of important natural habitats including legally protected areas and areas of high conservation value.
These issues require special attention within AtSource, as described below:
- Business Units must risk assess supply chains enrolling in AtSource to evaluate the likelihood of these issues existing in AtSource supply chains.
- Findings should be recorded on the Sustainability Assessment Checklist, and major or critical non-conformances require action to be taken before the products can enter AtSource.
- If any of these Unacceptable Practices are found in an AtSource supply chain at any time, these may lead to the supply chain suspension or exclusion as per the ofi Agri Supplier Code, Olam Agri Supplier Code and other sustainability policies. Immediate action must be taken to stop, resolve and mitigate the issue and allow the supply chains to enroll or remain in AtSource.
(To access the complete version of our sustainability requirements and SAC tool please contact us at atsource@ofi.com)
Action plans:
Managers of AtSource supply chains develop and implement action plans to ensure continuous improvement of sustainability performance. Action plans define the interventions and activities to be implemented, intended outcomes, timelines, and resources required for implementation. These are updated at least annually, based on verification outcomes of self-assessments and 3rd-party audits.
Our scheme rules explain in detail the assurance requirements and procedures that apply to AtSource supply chains. This includes assessing compliance with the AtSource Sustainability Principles; responding to risks and non-conformances through documented Action Plans; confirming traceability to the Farmer Group and establishing Chain of Custody systems. The system scope extends from agriculture through third party intermediaries to the final owned processing facility in the supply chain.
All AtSource supply chains undergo independent, 3rd-party verificaton to evaluate sustainability performance against AtSource requirements. The whole supply chain is audited, with sampling used to evaluate sustainability performance at farmer, intermediary, and processor level.
AtSourceV follows a verification cycle of three years. Supply chains undergo a 3rd-party verification audit at minimum once every three years. In other years, internal monitoring is conducted.
AtSource+ supply chains are audited by 3rd party verification bodies annually within a verification cycle of three years ( a “Verification audit” covering the full scope of our AtSource system requeriments is conducted during the first year, as part of the enrolment process in AtSource+, thereafter “survilliance audits” are conducted during the next two years to monitor the continous compliance of the sustainability requirements, data integrity and the ongoing implementation of the action plans).
Audit rules are contained in the AtSource Verification Protocol, the objective of which is to ensure that auditors conduct audits in a consistent manner and make verification decisions based on a truthful, accurate and fair representation of the level of the implementation of the requirements.
Audits are conducted by qualified auditors who work for authorised AtSource Verification Bodies that must adhere to the requirements of the AtSource Oversight Framework. This document covers topics such as organisational management of the Verification Body, auditor competence, and management of conflicts of interest and impartiality. The AtSource Verification Partner monitors Verification Body performance through quality reviews.
(For further information or request of our assurance and verification protocol, please contact us at atsource@ofi.com)
Traceability back to Farmer Group level or our estates is part of the AtSourceV and AtSource+ offer.
The AtSource environmental footprint calculator is founded on Life Cycle Assessment (LCA) methodology
(ISO 14044) and generates footprints in compliance with ISO14067, Greenhouse Gas Protocol Product Life-Cycle Accounting and Reporting Standard, and PAS 2050:2011.
The scope of the calculator starts at the crop production and ends when the product is delivered to a customer. Following LCA methodology enables multiple environmental impact indicators to be assessed. Those included in AtSource are Climate Change and Water Use:
- Climate change: IPCC 2021 GWP 100a impact assessment method is used, which uses the Global Warming Potential at 100 years. This indicator weights all greenhouse gases emissions (e.g., 1 kg of CH4 into the atmosphere is about equivalent to releasing 27.9 kg of CO2) according to their global warming potential and sums them into metric tonnes of CO2-e (equivalent) per unit of product.
- Water use: The calculator sums all freshwater used. Water use is expressed in m3 of water used per unit of product.
AtSourceV provides a country specific average product environmental footprint using generic data.
The AtSource+ environmental footprint calculator uses primary data generated from the full supply chain, including over 100 data points at the agricultural and processing facility stage, and precise distribution routes. The AtSource environmental calculator enables our customers to establish an environmental footprint that is unique to them.
Olam uses 3rd party risk screening tools as an indicator of the risk level of several material areas for every commodity in every country that we operate. The risk scores are aggregated and reviewed on an annual basis.
If 3rd party risk scores show an elevated level of risk, we use this knowledge in 2 ways:
- Inform our Olam Supplier Code (OSC) engagement discussions with our suppliers. We are able to talk to suppliers about these elevated risk areas and provide advice on how to avoid and/or mitigate the risk.
- Inform our business strategy and plan to tackle these challenges. We recognise that risk scores give a general indication of risk for a particular topic and country. We use this information to identify areas for further exploration and to prioritise strategic risk mitigation interventions.

This page is coming soon, as we are working on generating your country risk screening
Go BackThe risk scores are listed below:
UNDP Population in Multi-Dimensional Poverty
Elevated risk = score of 80 or above
Acceptable level of risk = score below 80
UNICEF Rural Child Labour
Elevated risk = score of 80 or above
Acceptable level of risk = score below 80
UNDP Gender Inequality Index
Elevated risk = score of 0.66 or above
Acceptable level of risk = score below 0.65
UNDP Mean years of schooling
Elevated risk = Below 7 years
Acceptable level of risk = 7 years and above
The Economist Global Food Security Index
Elevated risk = score of 50 or above
Acceptable level of risk = score below 50
UNDP HDI Life Expectancy at Birth
Elevated risk = Below 66 years
Acceptable level of risk = 67 years and above
ND-GAIN
Elevated risk = 1) high vulnerability, low readiness 2) high vulnerability, high readiness
Acceptable level of risk = 1) low vulnerability, low readiness; 2) low vulnerability, high readiness
WRI Aqueduct country score
Elevated risk = 1) medium to high risk; 2) high risk; 3) extremely high risk
Acceptable level of risk = low to medium risk
Total tree Cover Loss since 2000 (%) (WRI GFW)
Elevated risk = Greater than 4%
Acceptable level of risk = Less than 4%
GMAP HCV proxy - PS6 Presence and impact on high or unique terrestrial biodiversity
Elevated risk = score of 80 or above
Acceptable level of risk = score below 80
The key differences between the AtSourceV and AtSource Tiers are:
| Area of differentiation | AtSourceV | AtSource+ |
| Sustainability Requirements | AtSourceV uses a set of principles and criteria in 24 key sustainability areas of agricultural - supply chains to ensure responsible sourcing of AtSource products. | In addition to the sustainability requirements of AtSourceV, AtSource+ includes additional and more advanced requirements in each principle, creating additional intervention and impact. |
| Data and insights | Data for basic five ‘Portfolio’ metrics is collected and reported upon annually, providing a general overview of the farmer groups that are part of the AtSourceV supply chain. | Data for wide-ranging metrics on the economic, environmental, and social conditions is available in this tier, to provide deeper and more granular level of information and insight about the AtSource+ supply chain. |
| Environmental Footprint | AtSourceV provides a country specific average product environmental footprint using generic data. | The AtSource+ environmental footprint calculator uses primary data generated from the full supply chain, including over 100 data points at the agricultural and processing facility stage, and precise distribution routes. |
| Assurance & Verification | AtSourceV follows a verification cycle of three years. Supply chains undergo a 3rd-party verification audit conducted by authorised verification bodies at minimum once every three years. In other years, internal monitoring is conducted by our professionals in the ground. Scope of verification: Sustainability requirements compliance and performance assessment, traceability and chain of custody. | AtSource+ follows a verification cycle of three years. Supply chains undergo a 3rd-party verification audit conducted by authorised verification bodies annually. AtSource+ audits use a higher rate of sampling and a broader scope to provide a higher level of assurance regarding audit findings. Scope of verification: Sustainability requirements compliance and performance assessment, traceability, chain of custody and data integrity. |
Economic Opportunity
| Metric | Compulsory/Optional | Farmer Group/Estate/Both | Definition |
|---|---|---|---|
| Average yield of the farmer group baseline year | Compulsory | Farmer group | This metric reports the average yield (tonnes per hectare) for a specific baseline year for the target crop. |
| Average yield of the farmer group in the current year | Compulsory | Farmer group | This metric reports the average yield (tonnes per hectare) for a specific year (year of data uploaded to AtSource) for the target crop. |
| Estimated % change in average yield in a farmer group between current and baseline year | Compulsory | Farmer group | This metric is derived by calculating the difference between baseline yield and current yield. |
| Number of farmers in a farmer group who attended GAP training during the reporting period | Compulsory | Farmer group | This metric counts the number of farmers in a farmer group that have attended Good Agricultural Practices (GAP) training. GAP includes planting of shade trees, pest management, weeding, sanitary, soil fertility and pruning. |
| Percentage of farmers in a farmer group who have attended GAP training | Compulsory | Farmer group | This metric is derived by calculating what percentage of farmers in the farmer group have attended Good Agricultural Practices (GAP) training. |
| Premium paid to a farmer group | Optional | Farmer group | This metric reports the premiums paid to the farmer group that are above the standard price for a product. |
| Number of Seedling Plants distributed to a farmer group | Optional | Farmer group | This metric reports the tonnes of seedlings distributed to a farmer group by Olam in the reporting 12 months. |
| Number of tonnes of Seeds distributed to a farmer group | Optional | Farmer group | This metric reports the tonnes of seeds distributed to a farmer group by Olam in the reporting 12 months. |
| Number of tonnes of Fertiliser distributed to a farmer group | Optional | Farmer group | This metric reports the tonnes of synthetic fertiliser distributed to a farmer group by Olam in the reporting 12 months. |
| Loans provided to a farmer group | Optional | Farmer group | This metric reports loans provided by Olam to the farmer group or its members. Typically for crop purchase, agri-inputs, tools, etc. |
| Total value of farm support equipment distributed | Optional | Farmer group | This metric reports the value ($) of farm support equipment provide by Olam to the farmer group. Examples includes: PPE (gloves, goggles, respirators), productive tools, etc. |
| Number of farmer households benefitting from Olam rural infrastructure support | Optional | Farmer group | This metric reports the number of farmer households benefitting from Olam rural infrastructure support. Examples include: roads, bridges, electricity, etc. |
| Number of beneficiaries receiving food crop production support | Optional | Farmer group | This metric reports the number of beneficiaries connected to farmer group receiving food crop production support from Olam. Examples include: seeds, finance, training on GAP for food crops, etc. |
| Number of beneficiaries receiving food loss reduction support | Optional | Farmer group | This metric reports the number of beneficiaries connected to farmer group receiving food loss reduction support. Examples include: storage equipment, processing equipment, pest control, etc. |
| Number of farmers received coaching to improve agricultural practices | Optional | Farmer group | This metric reports the number of farmers received coaching to improve agricultural practices. |
| Number of Farmers received a Farmer Development Plan | Optional | Farmer group | A Farm Development Plan (FDP) is a customised document that outlines concrete actions and results that a farmer plans to achieve on their farm. This metric reports how many farmers in farmer group have an FDP. |
| Average GAP Adoption Score | Optional | Farmer group | This metric reports the average GAP Adoption Score for the farmer group. GAP includes planting of shade trees, pest management, weeding, sanitary, soil fertility and pruning. |
| Number of hectares rehabilitated | Optional | Farmer group | This metric reports the number of hectares rehabilitated in the farmer group. |
| Average productivity change (kg per ha) for trained farmers | Optional | Farmer group | This metric reports the average productivity change (kg per ha) for trained (e.g. GAP training) farmers. |
| Number of farmer households that achieve a living income | Optional | Farmer group | This metric reports the number of farmer households that are earning above the living income benchmark. Developed by Agri-Logic based on an initial assignment from Rainforest Alliance, this tool is being made available to other interested parties via TRACT. The tool uses modeling to estimate farmers' income, calibrated with detailed datasets from a relatively small group of farmers in a specific area. It employs a linear model that combines crop production volume and data on non-crop income to estimate net household income. The advantage of this approach is that once the model is established, very few data points are needed to estimate the household income of a larger population of farmers – whether in a project, group, region, supply chain, or country. Once the estimated farmer household income is calculated, the metric is derived by comparing it with the living income benchmark for that country. The benchmark values are almost exclusively from Anker Research Institute (Benchmark or Reference values) with a few exceptions sourced from the Living Income Community of Practice. |
| Percentage of farmer households that achieve a living income | Optional | Farmer group | This metric is derived by dividing the number of farmer households that achieve a living income by the total number of farmer households in the farmer group. |
| Expected yield | Optional | Estate | This metric reports the expected tonnes of product per hectare of land in the Estate. |
| Actual yield | Optional | Estate | This metric reports the actual tonnes of product per hectare of land in the Estate. |
| Percentage change in actual yield versus expected yield | Compulsory | Estate | This metric is derived by calculating the difference between actual yield and expected yield. |
| Tonnes of fertiliser used on farm holding | Optional | Estate | This metric reports the tonnes of fertiliser used on the Estate in the reporting year. |
| Loans provided to workforce | Optional | Estate | This metric reports the loans ($) provided to workforce. |
| Households benefiting from rural infrastructure investments made in the past year | Optional | Estate | This metric reports the number of households (connected to Estate) benefitting from Olam rural infrastructure support. Examples include: roads, bridges, electricity, etc. |
| Households receiving food crop production support | Optional | Estate | This metric reports the number of households (connected to Estate) receiving food crop production support from Olam. Examples include: seeds, finance, training on GAP for food crops, etc. |
| Households supported to reduce food loss and waste | Optional | Estate | This metric reports the number of households (connected to Estate) receiving food loss reduction support. Examples include: storage equipment, processing equipment, pest control, etc. |
| Total housing on site | Optional | Estate | This metric reports the number of houses / apartments blocks available on the Estate for Olam employees. |
| Total workers staying in Olam's housing | Optional | Estate | This metric reports the number of employees accessing housing from Olam on the Estate. |
| Percentage paid above the legal minimum wage | Optional | Estate | This metric reports the percentage paid to Olam employees (only covers workers and does not include managers) above the legal minimum wage in the Estate. |
| Percentage of workforce from local community | Optional | Estate | This metric reports the percentage of workforce who come from the local community. |
Safe and Decent Work
| Metric | Compulsory/Optional | Farmer Group/Estate/Both | Definition |
|---|---|---|---|
| Number of farmers in a farmer group trained on good labour practices. | Compulsory | Farmer group | This metric reports the number of farmers in a farmer group trained on good labour practices in the reporting period. Example trainings are: Elaboration of Association's constitution, Accounting and Meeting Management, etc. |
| Percentage of farmers in a farmer group trained on good Labour practices | Compulsory | Farmer group | This metric is derived by calculating what percentage of farmers in the farmer group have been trained on good labour practices. |
| Is an active and effective CLMRS in place for a high risk farmer group? | Optional | Farmer group | Child Labour Monitoring and Remediation Systems (CLMRS) is required if the farmer group is at a high risk for child labour. This metric report if an active and effective CLMRS is in place for the farmer group. |
| Number of farmers in a farmer group trained on health & safety practices | Optional | Farmer group | This metric reports the number of farmers in a farmer group trained on health & safety practices. Example trainings are: Occupational Health & Safety, Nutrition & General Health, First Aid & Emergency Procedures, etc. |
| Percentage of farmers in a farmer group trained on health & safety practices | Optional | Farmer group | This metric is derived by calculating what percentage of farmers in the farmer group have been trained on health & safety practices. |
| Number of Olam employees trained on health & safety practices | Optional | Farmer group | This metric reports the number of Olam employees connected to the farmer group that are trained on health & safety practices. Example trainings are: Occupational Health & Safety, Nutrition & General Health, First Aid & Emergency Procedures, etc. |
| Percentage of Olam employees trained on health & safety practices | Optional | Farmer group | This metric is derived by calculating what percentage of Olam employees connected to the farmer group have been trained on health & safety practices. |
| LTIFR (Lost Time Injury Frequency Rate) in Olam’s processing facilities in the last year | Optional | Farmer group | This metric reports the Lost Time Injury Frequency Rate (LTIFR) in Olam’s processing facilities connected to the farmer group in the last year. |
| Number of farmers covered by a CLMRS | Optional | Farmer group | This metric reports the number of farmers covered by an active and effective Child Labour Monitoring and Remediation System (CLMRS). |
| Number of children identified in child labour through inspections | Optional | Farmer group | This metric reports the number of children identified in child labour through inspections. |
| Number of child labour cases remediated | Optional | Farmer group | This metric reports the number of child labour cases remediated. Remediation actions will vary on a case-by case basis according to the causes identified, whilst ensuring alignment with the community and cooperative environment to provide the most efficient responses. |
| Employees trained on labour rights and practices | Compulsory | Estates | This metric reports the number of employees trained on labour rights and practices in the Estate. Example trainings are: Protecting temporary workers’ right to receive a fair and decent wage for their work, workers knowing their rights as well as expedient judicial mechanisms to ensure labour-employer disputes are resolved in a fair and expedient manner, etc. |
| Percentage of employees trained on labour rights and practices | Compulsory | Estates | This metric is derived by calculating what percentage of employees have been trained on labour rights and practices. |
| Employees trained on health & safety | Optional | Estates | This metric reports the number of Olam employees in the Estate that are trained on health & safety practices. Example trainings are: Occupational Health & Safety, Nutrition & General Health, First Aid & Emergency Procedures, etc. |
| Percentage of employees trained on health & safety | Optional | Estates | This metric is derived by calculating what percentage of Olam employees in the Estate have been trained on health & safety practices. |
| LTIFR in farm holding in the last year | Optional | Estates | This metric reports the Estate Lost Time Injury Frequency Rate (LTIFR) for the reporting period. The number of lost time injuries occurring in farm holding per 200,000 person-hours. |
| Number of employees occupying a position with hazard or at risk | Optional | Estates | This metric reports the number of employees in a position with hazard or risk. A Hazardous or risky position would include situations like application of harmful chemicals without protection, operating machinery i.e. chainsaw, etc. |
| Average somatic cell count of herd [Dairy only] | Optional | Estates | This metric reports the number of somatic cells per ml of raw milk. |
| Lameness percentage of herd [Dairy only] | Optional | Estates | This metric reports the number of cows with lameness as a percentage of total number of cows. |
| Cases of mastitis [Dairy only] | Optional | Estate | This metric reports the number of cows suffering from mastitis. Mastitis is most often transmitted by contact with the milking machine, and through contaminated hands or other materials, in housing, bedding and other equipment. |
| Total bacterial count in milk [Dairy only] | Optional | Estate | This metric reports the total bacterial count per ml of raw milk. |
Diversity and Inclusion
| Metric | Compulsory/Optional | Farmer Group/Estate/Both | Definition |
|---|---|---|---|
| Number of registered farmers in a farmer group held by women | Compulsory | Farmer group | This metric reports the number of female farmers in a farmer group. |
| Percentage of female registered farmers in a farmer group | Compulsory | Farmer group | This metric is derived and calculates the percentage of female farmers in the farmer group. |
| Number of female farmers attending GAP training | Compulsory | Farmer group | This metric reports the number of female farmers in a farmer group that have attended Good Agricultural Practices (GAP) training. |
| Percentage of female farmers attending GAP training | Compulsory | Farmer group | This metric is derived and calculates what percentage of female farmers in the farmer group have attended Good Agricultural Practices (GAP) training. |
| Number of leadership positions in a farmer group | Optional | Farmer group | This metric reports the number of leadership positions in a farmer group. Example leadership positions include: people who represent the groups’ members, chair, vice chair, treasurer, secretary, etc. |
| Number of women in a farmer group holding leadership positions. | Optional | Farmer group | This metric reports the number of female farmers in a farmer group that hold a leadership position. Example leadership positions include: people who represent the groups’ members, chair, vice chair, treasurer, secretary, etc. |
| Percentage of female farmers in a farmer group holding a leadership position | Optional | Farmer group | This metric is derived and calculates what percentage of female farmers in a farmer group hold a leadership position. |
| Female employees in workforce | Compulsory | Estates | This metric reports the number female employees in the Estate workforce. |
| Percentage of female employees in workforce | Compulsory | Estates | This metric is derived and calculates the percentage of female employees in the Estate workforce. |
| Managers in the workforce | Optional | Estates | This metric reports the number managers in the Estate workforce. |
| Females in a management role in the workforce | Optional | Estates | This metric reports the number female managers in the Estate workforce. |
| Percentage of Females in a management role in the workforce | Optional | Estates | This metric is derived and calculates the percentage of females in a management role in the Estate workforce. |
| National workforce | Optional | Estates | This metric reports the number of the workforce that are from the country of operation. |
| Foreign workforce | Optional | Estates | This metric reports the number of the workforce that are not from the country of operation. These employees must have a valid work status (permit) to work in our Estates. |
| Percentage of 'skilled' position occupied by women | Optional | Estates | This metric reports the percentage of 'skilled' position occupied by women. Skilled position is defined as any worker who has special skill, training or knowledge. Examples include: engineers, crane operators, truck drivers, machinist, drafters, plumbers, etc. |
Education and Skills
| Metric | Compulsory/Optional | Farmer Group/Estate/Both | Definition |
|---|---|---|---|
| Percentage of school aged children attending school | Compulsory | Farmer group | This metric reports the percentage of school aged children linked to the farmer group that are attending school. |
| Number of beneficiaries with access to education support | Optional | Farmer group | This metric reports the number of beneficiaries attached to the farmer group and catchment community with access to education support. Examples of education support include: literacy classes, vocational training, sponsoring teaching activities, etc. |
| Number of beneficiaries with school infrastructure and equipment | Optional | Farmer group | This metric reports the number of beneficiaries attached to the farmer group and catchment community benefitting from school infrastructure and equipment investments made in the past year. Examples of school infrastructure and equipment investments include: construction or renovation of classrooms, libraries, canteens, teacher housing, sanitary blocks, dormitories etc. |
| Number of beneficiaries with education services | Optional | Farmer group | This metric reports the number of beneficiaries with education services. Examples include: initiatives that reduce entry barriers to enrolment, such as support for birth certificates, awareness of the importance of school, school transport support, etc. |
| Number of Olam farmers' children that have received education support | Optional | Farmer group | This metric reports the number of Olam farmers' children that have received education support. Education support is defined as: providing educational opportunities (e.g. building school, providing/replacing school infrastructure, helping establish birth certificates, etc.), or income support (support to attend school, income generating activities, village savings, etc). |
| School aged children attending school | Compulsory | Estates | This metric reports the number of school aged children linked to the Estate workforce and catchment community that are attending school. |
| People with access to education support | Optional | Estates | This metric reports the number of people linked to the Estate workforce and catchment community with access to education support. Examples of education support include: literacy classes, vocational training, sponsoring teaching activities, etc. |
| Students benefitting from school infrastructure and equipment investments | Optional | Estates | This metric reports the number of students linked to the Estate workforce and catchment community benefitting from school infrastructure and equipment investments made in the past year. Examples of school infrastructure and equipment investments include: construction or renovation of classrooms, libraries, canteens, teacher housing, sanitary blocks, dormitories etc. |
Health and Nutrition
| Metric | Compulsory/Optional | Farmer Group/Estate/Both | Definition |
|---|---|---|---|
| Percentage of farmer households with access to healthcare facilities | Compulsory | Farmer group | This metric reports the percentage of farmer households with access to healthcare facilities. Focusing on physical accessibility (and not other aspect of access, namely financial affordability and acceptability). |
| Percentage of farmer households with access to clean drinking water and sanitation | Compulsory | Farmer group | This metric reports the percentage of farmer households with access to clean (improved as defined by WHO) drinking water and sanitation. |
| Percentage of farmer households that are food secure | Compulsory | Farmer group | This metric reports the percentage of farmer households that are food secure, following the Months of Adequate Household Food Provisioning (MAHFP) methodology. |
| Number of beneficiaries receiving health infrastructure and equipment | Optional | Farmer group | This metric reports the number of beneficiaries receiving health infrastructure and equipment. Examples of health infrastructure and equipment include: construction and renovation of clinics, water-wells, sanitary facilities, etc. |
| Number of beneficiaries receiving healthcare services provided and supported by Olam | Optional | Farmer group | This metric reports the number of beneficiaries (‘beneficiaries' include both community members and workers) receiving healthcare services provided and supported by Olam. Examples of healthcare services include medicines, health check-ups, HIV testing, etc. as well as health care services from e.g. community health workers or hospitals etc. that Olam supports. |
| Number of beneficiaries attending health sensitisation / health training | Optional | Farmer Group | This metric reports the number of beneficiaries attending health sensitisation / health training. Examples of health sensitisation/health training include: chronic disease prevention and management (including obesity, but not under-nutrition). |
| Number of beneficiaries receiving nutrition support | Optional | Farmer Group | This metric reports the number of beneficiaries receiving nutrition support. Examples of nutrition support include: health eating, weight-management training, micronutrient fortification, etc. |
| Percentage of households with access to healthcare facilities | Compulsory | Estates | This metric reports the percentage of households (connected to workforce) with access to healthcare facilities. Focusing on physical accessibility (and not other aspect of access, namely financial affordability and acceptability). |
| Households with access to clean drinking water and sanitation | Compulsory | Estates | This metric reports the number of households (connected to workforce) with access to clean (improved as defined by WHO) drinking water and sanitation. |
| Percent of households that are food secure | Compulsory | Estates | This metric reports the percentage of households (connected to workforce) that are food secure, following the Months of Adequate Household Food Provisioning (MAHFP) methodology. |
| Households benefitting from health infrastructure and equipment investments | Optional | Estates | This metric reports the households (connected to workforce) benefitting from health infrastructure and equipment investments. Examples of health infrastructure and equipment include: construction and renovation of clinics, water-wells, sanitary facilities, etc. |
| People receiving support to access healthcare services | Optional | Estates | This metric reports the number of people (linked to the workforce and catchment community) receiving support to access healthcare. Examples of healthcare services include medicines, health check-ups, HIV testing, etc. as well as health care services from e.g. community health workers or hospitals etc. that Olam supports. |
| People receiving health education | Optional | Estates | This metric reports the number of people (linked to the workforce and catchment community) receiving health education. Examples of health education include: chronic disease prevention and management (including obesity, but not under-nutrition). |
| Households that are receiving nutrition support | Optional | Estates | This metric reports the number of households that are receiving nutrition support Examples of nutrition support include: health eating, weight-management training, micronutrient fortification, etc. |
| Number of toilets per 100 workers | Optional | Estates | This metric reports the number of toilets per 100 workers. |
Healthy Soils
| Metric | Compulsory/Optional | Farmer Group/Estate/Both | Definition |
|---|---|---|---|
| Number of farmers in a farmer group trained on soil improvement initiatives | Optional | Farmer group | This metric reports the number of farmers in a farmer group trained on soil improvement initiatives. Examples soil improvement initiatives include: composting, mulching, cover crop, fertiliser optimisation, erosion mitigation, etc. |
| Percentage of farmers in the farmer group who have attended soil improvement training | Optional | Farmer group | This metric is derived and calculates the percentage of farmers in the farmer group who have attended soil improvement training. |
| Number of hectares in a farmer group benefitting from soil improvement initiatives [Training] | Optional | Farmer group | This metric reports the number of hectares in a farmer group benefitting from soil improvement initiatives. Examples of soil improvement initiatives include: leguminous cover crops or trees, crop rotation, inter-cropping. |
| Hectares benefitting from integrated soil fertility management | Optional | Estates | This metric reports the number of hectares benefitting from integrated soil fertility management. Examples of integrated soil fertility management include: leguminous cover crops or trees, crop rotation, inter-cropping. |
| Phosphorus use efficiency | Optional | Estates | This metric reports the phosphorus use efficiency (PUE). PUE is the percentage of the applied phosphorus fertiliser nutrient that is taken up by the plant and used to grow and produce yield. |
| Nitrogen use efficiency | Optional | Estates | This metric reports the nitrogen use efficiency (NUE). NUE is the percentage of the applied nitrogen fertiliser nutrient that is taken up by the plant and used to grow and produce yield. |
| Percentage of non-chemical Integrated Pest Management practices | Optional | Estates | This metric reports the percentage of non-chemical Integrated Pest Management practices use on the Estate. This is calculated by listing out all pest control practices implemented on the farms, including chemical, agronomic, mechanical, biological and innovative practices and determine the percentage of non-chemical practices. |
Healthy Eco-Systems
| Metric | Compulsory/Optional | Farmer Group/Estate/Both | Definition |
|---|---|---|---|
| Number of farmers in a high risk farmer group trained on Olam Living Landscape Policy | Optional | Farmer group | This metric reports the number of farmers in a high risk (>4% tree cover loss result) farmer group trained on Olam Living Landscape Policy. |
| Percentage of farmers in a high risk farmer group trained on Olam Living Landscape Policy | Optional | Farmer group | This metric is derived and calculates the percentage of farmers in a high-risk farmer group trained on Olam Living Landscape Policy. |
| Number of farmers in high risk farmer group whose GPS co-ordinates mapped | Optional | Farmer group | This metric reports the number of farmers in high risk farmer group whose GPS co-ordinates mapped. |
| Percentage of farmers in a high risk farmer group whose GPS co-ordinates are mapped | Optional | Farmer group | This metric is derived and calculates the percentage of farmers in a high-risk farmer group whose GPS co-ordinates are mapped. |
| Number of shade trees distributed | Optional | Farmer Group | This metric reports the number of shade trees distributed to a farmer group by Olam. Examples of shade tree include: Erythrina, Inga, Gliricidia, Terminalia, Albizia, etc. |
| Number of estates in farm holding with GPS co-ordinates mapped | Optional | Estates | This metric reports the number of estates in farm holding with GPS co-ordinates mapped. |
| Percentage of farm holding under protection/conservation | Optional | Estates | This metric reports the percentage of farm holding under protection/conservation. |
| Landscape Deforestation Risk Index | Compulsory | Both | This metric calculates the risk of future deforestation in the landscape around a farmer group, farm holding, or concession based on past 5 years of deforestation in the area. If the calculated risk index is above 4%, then the risk for future deforestation nearby is considered high. |
| Farm Deforestation Risk Index | Optional | Both | This metric calculates the risk of future deforestation in the landscape around a farmer group, farm holding, or concession based on past 5 years of deforestation in the area. If the calculated risk index is above 4%, then the risk for future deforestation nearby is considered high. |
Climate Action
| Metric | Compulsory/Optional | Farmer Group/Estate/Both | Definition |
|---|---|---|---|
| Land Use Change | Compulsory | Both | This metric reports the carbon emissions (tonnes CO2-e) related to deforestation over a 20-year period. |
| Carbon Sequestration - Trees | Compulsory | Both | This metric reports the amount of carbon, presented as carbon emissions (tonnes CO2-e), that is sequestered in the farmer groups’ biomass. |
| Carbon Sequestration - Soil | Compulsory | Both | This metric reports the amount of carbon, presented as carbon emissions (tonnes CO2-e), that is sequestered in the farmer groups’ soil. |
| Seeds Seedlings Tree Planting and Clearing | Compulsory | Both | This metric reports the carbon emissions (tonnes CO2-e) relating to growing seeds and seedlings, and emissions related to uprooting and planting of trees. |
| Fertiliser Production | Compulsory | Both | This metric reports the carbon emissions (tonnes CO2-e) related to energy consumed when producing fertilisers. |
| Fertiliser Use | Compulsory | Both | This metric reports the carbon emissions (tonnes CO2-e) from the application of synthetic or organic fertilisers, in addition to soil emissions. |
| Pesticide Production | Compulsory | Both | This metric reports the carbon emissions (tonnes CO2-e) related to energy consumed when producing pesticides. |
| Pesticide Use | Compulsory | Both | This metric reports the carbon emissions (tonnes CO2-e) from the application of pesticides. |
| Irrigation | Compulsory | Both | This metric reports the carbon emissions (tonnes CO2-e) related to infrastructure and machinery used to deliver water to crops, and water consumed to irrigate. |
| Farm Machinery | Compulsory | Both | This metric reports the carbon emissions (tonnes CO2-e) related to machines used (e.g. fuel consumed) on the farm. |
| Electricity | Compulsory | Both | This metric reports the carbon emissions (tonnes CO2-e) related to grid electricity consumed on the farm. |
| Post Harvest Activities | Compulsory | Both | This metric reports the carbon emissions (tonnes CO2-e) related to post-harvest activities on the farm e.g. washing or residue removal. |
| Crop Residues Management | Compulsory | Both | This metric reports the carbon emissions (tonnes CO2-e) from crop residue management that were or were not harvested. |
| Rice Cultivation [Rice only] | Compulsory | Farmer Groups | This metric reports the carbon emissions (tonnes CO2-e) of rice cultivation in paddy field, with the main contributor being methane emissions. |
| Feed Production [Dairy only] | Compulsory | Estates | This metric reports the carbon emissions (tonnes CO2-e) of producing feed (e.g. silage soy, grain, etc) for animal production systems. |
| Enteric Fermentation [Dairy only] | Compulsory | Estates | This metric reports the carbon emissions (tonnes CO2-e) of enteric fermentation. The natural part of the digestive process in ruminant animals, where microbes in the digestive tract, decompose and ferment food, producing methane as a by-product. |
| Manure Management [Dairy only] | Compulsory | Estates | This metric reports the carbon emissions (tonnes CO2-e) of managing manure produced by animals in the Estate. |
| Grid electricity used in processing | Compulsory | Both | This metric reports the carbon emissions (tonnes CO2-e) related to electricity consumed in processing. |
| Fossil fuels used in processing | Compulsory | Both | This metric reports the carbon emissions (tonnes CO2-e) related to electricity consumed in processing. |
| Biomass used in processing | Compulsory | Both | This metric reports the carbon emissions (tonnes CO2-e) related to biomass consumed in processing. |
| Renewables used in processing | Compulsory | Both | This metric reports the carbon emissions (tonnes CO2-e) related to renewable energy consumed in processing. |
| Incineration used in processing | Compulsory | Both | This metric reports the carbon emissions (tonnes CO2-e) related to incineration in processing. |
| Others used in processing | Compulsory | Both | This metric reports the carbon emissions (tonnes CO2-e) related to other activities in processing, e.g. composting. |
| Inland (origination) | Compulsory | Both | This metric reports the carbon emissions (tonnes CO2-e) for transport from farm to departure port. |
| Inland (processing) | Compulsory | Both | This metric reports the carbon emissions (tonnes CO2-e) for transport from farm to processing, or from port to processing facility. |
| Sea freight (processing) | Compulsory | Both | This metric reports the carbon emissions (tonnes CO2-e) for transport by ship arriving at a processing facility. |
| Sea freight (delivery) | Compulsory | Both | This metric reports the carbon emissions (tonnes CO2-e) for delivering from departure port to destination port by ship. |
| In-land (delivery) | Compulsory | Both | This metric reports the carbon emissions (tonnes CO2-e) for delivering from processing to port or delivering from any place to the destination by ground transport. |
Water
| Metric | Compulsory/Optional | Farmer Group/Estate/Both | Definition |
|---|---|---|---|
| Land Use Change | Compulsory | Both | This metric reports the water use (m3) related to deforestation over a 20-year period. |
| Seeds Seedlings Tree Planting and Clearing | Compulsory | Both | This metric reports the water use (m3) relating to growing seeds and seedlings, and emissions related to uprooting and planting of trees. |
| Fertiliser Production | Compulsory | Both | This metric reports the water use (m3) related to energy consumed when producing fertilisers. |
| Fertiliser Use | Compulsory | Both | This metric reports the water use (m3) from the application of synthetic or organic fertilisers, in addition to soil emissions. |
| Pesticide Production | Compulsory | Both | This metric reports the water use (m3) related to energy consumed when producing pesticides. |
| Pesticide Use | Compulsory | Both | This metric reports the water use (m3) from the application of pesticides. |
| Irrigation | Compulsory | Both | This metric reports the water use (m3) related to infrastructure and machinery used to deliver water to crops, and water consumed to irrigate. |
| Farm Machinery | Compulsory | Both | This metric reports the water use (m3) related to machines used (e.g. fuel consumed) on the farm. |
| Electricity | Compulsory | Both | This metric reports the water use (m3) related to grid electricity consumed on the farm. |
| Post Harvest Activities | Compulsory | Both | This metric reports the water use (m3) related to post-harvest activities on the farm e.g. washing or residue removal. |
| Crop Residues Management | Compulsory | Both | This metric reports the water use (m3) from crop residue management that were or were not harvested. |
| Feed Production [Dairy only] | Compulsory | Estates | This metric reports the water use (m3) of producing feed (e.g. silage soy, grain, etc) for animal production systems. |
| Manure Management [Dairy only] | Compulsory | Estates | This metric reports the water use (m3) of managing manure produced by animals in the Estate. |
| Grid electricity used in processing | Compulsory | Both | This metric reports the water use (m3) related to electricity consumed in processing. |
| Fossil fuels used in processing | Compulsory | Both | This metric reports the water use (m3) related to electricity consumed in processing. |
| Biomass used in processing | Compulsory | Both | This metric reports the water use (m3) related to biomass consumed in processing. |
| Renewables used in processing | Compulsory | Both | This metric reports the water use (m3) related to renewable energy consumed in processing. |
| Incineration used in processing | Compulsory | Both | This metric reports the water use (m3) related to incineration in processing. |
| Others used in processing | Compulsory | Both | This metric reports the water use (m3) related to other activities in processing, e.g. composting. |
Reduced Waste
| Metric | Compulsory/Optional | Farmer Group/Estate/Both | Definition |
|---|---|---|---|
| Percentage of Product Lost Post-Harvest | Optional | Farmer group | This metric reports the percentage of product (per tonne) that is lost post-harvest of primary product on-farm in a farmer group. |
| Volume of Organic Residue Generated | Optional | Farmer group | This metric reports the volume of organic residue generated (tonnes per hectare) during agriculture. |
| Percentage of Organic Residue Actively Managed | Optional | Farmer group | This metric reports the volume (tonnes) of organic residue generated on-farm that is actively managed. |
| Volume of Waste Generated | Optional | Farmer group | This metric reports the volume (tonnes) of waste generated at a processing facility. |
| Percentage of Waste Generated Sent to Landfill | Optional | Farmer group | This metric the percentage of all waste generated at a processing facility that is sent to landfill. |
| Volume of Waste Recycled | Optional | Farmer group | This metric reports the volume (tonnes) of waste recycled at a processing facility. |
| Rate of Waste Recycling | Optional | Farmer group | This metric reports the rate of waste recycling at a processing facility (i.e., the percentage of total waste generated that is recycled). |
| Volume of Regulated Hazardous Waste Generated | Optional | Farmer group | This metric reports the volume (tonnes) of regulated hazardous waste generated at a processing facility. |
| Percentage of Regulated Hazardous Waste Recycled | Optional | Farmer group | This metric reports the percentage of regulated hazardous waste generated at a processing facility that is recycled. |
| Percentage of Regulated Hazardous Waste Sent to Landfill | Optional | Farmer group | TThis metric reports the percentage of regulated hazardous waste generated at a processing facility that is sent to landfill. |
| Percentage of Product Lost Post-Harvest | Optional | Estate | This metric reports the percentage of product (per tonne) that is lost post-harvest of primary product on-farm in a farm holding or concession. |
| Volume of Organic Residue Generated | Optional | Estate | This metric reports the volume of organic residue generated (tonnes per hectare) during agriculture. |
| Percentage of Organic Residue Actively Managed | Optional | Estate | This metric reports the volume (tonnes) of organic residue generated on-farm in a farm holding or concession that is actively managed. |
| Volume of Waste Generated | Optional | Estate | This metric reports the volume (tonnes) of waste generated at a processing facility. |
| Percentage of Waste Generated Sent to Landfill | Optional | Estate | This metric reports the percentage of all waste generated at a processing facility that is sent to landfill. |
| Volume of Waste Recycled | Optional | Estate | This metric reports the volume (tonnes) of waste recycled at a processing facility. |
| Rate of Waste Recycling | Optional | Estate | This metric reports the rate of waste recycling at a processing facility (i.e., the percentage of total waste generated that is recycled). |
| Volume of Regulated Hazardous Waste Generated | Optional | Estate | This metric reports the volume (tonnes) of regulated hazardous waste generated at a processing facility. |
| Percentage of Regulated Hazardous Waste Recycled | Optional | Estate | This metric reports the percentage of regulated hazardous waste generated at a processing facility that is recycled. |
| Percentage of Regulated Hazardous Waste Sent to Landfill | Optional | Estate | This metric reports the percentage of regulated hazardous waste generated at a processing facility that is sent to landfill. |
Natural Capital
| Metric | Compulsory/Optional | Farmer Group/Estate/Both | Definition |
|---|---|---|---|
| Carbon (GHG Cost and Benefit) | Optional | Both | This metric accounts for the total emissions arising from Agriculture, Processing & Transportation. |
| Carbon - Overall Agriculture | Optional | Both | This metric accounts for the total annual emissions arising from Agriculture operations for producing the Product e.g. Fertiliser Use, Crop Residues Management and historic Land Use Change. The metric also accounts for the emissions sequestrated by cocoa trees and shade trees (does not include forest & fruit trees planted). |
| Carbon - Overall Processing | Optional | Both | This metric accounts for the total annual emissions arising from various sources in Processing operations e.g. Electricity, Natural Gas, Packaging. Thus, presents Social cost of Carbon associated with the Farmer Group/Estate for processing the Product. |
| Carbon - Overall Transport | Optional | Both | This metric accounts for the total annual emissions arising from Transporting goods through various routes e.g. emissions from Sea Delivery, Inland Delivery. Thus, presents Social cost of Carbon associated with the Farmer Group/Estate for all transportation emissions. |
| Water Use (Cost) | Optional | Both | This metric accounts for the total economic value of annual water consumption in Agriculture and Processing. |
| Water - Overall Agriculture | Optional | Both | This metric accounts for the total annual water consumption in Agriculture operations for producing the Product e.g. water used in Irrigation, Fertiliser Production, Fertiliser Use. |
| Water - Overall Processing | Optional | Both | This metric accounts for the total annual water consumption in Processing operations e.g. water used in electricity generation and other purposes. |
| Ecosystem Services | Optional | Both | This metric accounts for the annual economic value of ecosystem services lost or gained in Agriculture operations by placing a monetary value on ecosystem services - provisioning, regulating, habitat and cultural services. |
| Land - Overall Agriculture | Optional | Both | This metric accounts for the annual ecosystem services lost or gained in Agriculture operations by placing a monetary value on ecosystem services - provisioning, regulating, habitat and cultural services. It accounts for ecosystem services lost due to historic Land Use Change. The positive impact in terms of ecosystem services from planting forest & fruit trees not yet included. The positive impact in terms of ecosystem services from cocoa farms not yet included. |
ATSOURCE
TERMS AND PRIVACY
CONNECT
Need Help?


See how tiles work
Find out more
How can we help you?